How does it work?

Satellite radar imaging

Successful ice travel includes understanding the types of ice, monitoring the changes in the ice, and the hazards that form. Ice Time™ does this for you by displaying current high resolution satellite radar images published to you in near real-time, usually within a day. Radar satellites “see” at night and through clouds. In the winter radar also sees through the snow to the ice. These all-weather satellites provide the images we need to monitor lake ice frequently and reliably.

Radar satellites emit energy so image data can be collected through clouds, at night, through snow.

Radar satellites emit energy so image data can be collected through clouds, at night, through snow.

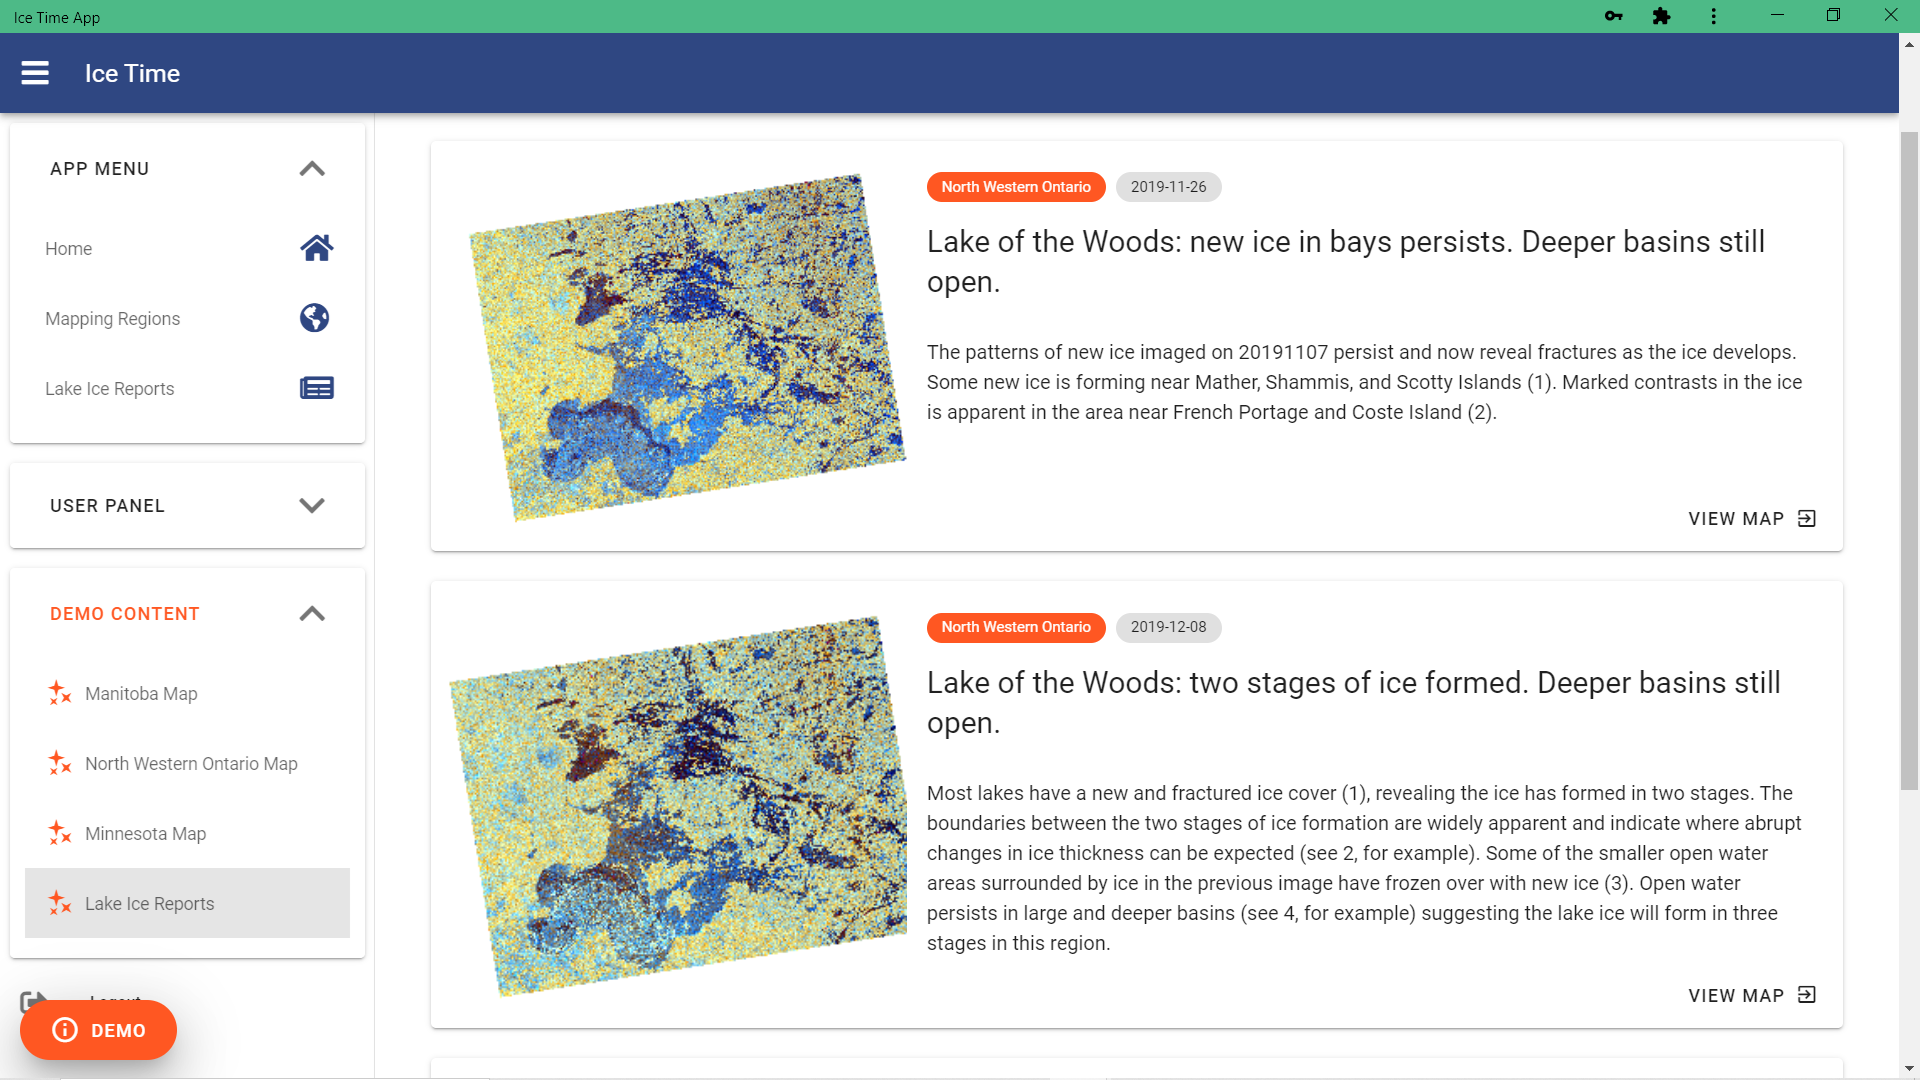
What do Ice Time™ maps look like?

Your radar maps will show changes in the ice over time.  The images from each ice period are displayed differently in Ice Time™ so they are easy to understand. Ice Time™ uses false colors because radar images do not need or use sunlight to form images. Let’s start with new ice and winter ice as examples. See the descriptions below each image to interpret the colors.

New ice mapping. Southern basin of Lake Winnipeg during freeze up showing fragmented ice sheets drifting north exposing open water in the south. Forests are yellow, agricultural fields are light blue. Mapping icons are not displayed at this scale.

New ice mapping. Southern basin of Lake Winnipeg during freeze up showing fragmented ice sheets drifting north exposing open water in the south. Forests are yellow, agricultural fields are light blue. Mapping icons are not displayed at this scale.

Winter ice mapping. Southern basin of Lake Winnipeg. Rubble (rough) ice is mapped in red, pressure ridges are yellow, and smooth ice is blue. The smoothest ice formed under low wind, and appears dark blue. Land is grey. Remember, you are seeing through the snow cover! Mapping icons are not displayed at this scale.

Winter ice mapping. Southern basin of Lake Winnipeg. Rubble (rough) ice is mapped in red, pressure ridges are yellow, and smooth ice is blue. The smoothest ice formed under low wind, and appears dark blue. Land is grey. Remember, you are seeing through the snow cover! Mapping icons are not displayed at this scale.

Mapping Icons

Key observations described in the ice reports are also marked by us on the radar maps, using easy to understand icons. The icon colors shown here are reserved for the Ice Time™ scientific staff, so you know it comes from us. Users map features using blue icons.

admin icons July 21 2021.png
User icons July 21 2021.png

When you zoom in the hazard and incident icons appear.

Winter mapping often shows smooth ice (blue), rubble ice (rough ice shown as red), and pressure ridges (yellow lines). Land is grey. Mapping icon are shown at select sites to get your oriented. Our research using satellites and drones on rough ice revealed we can map ridges or rough ice starting at 10cm (4”). In this image most of the rubble ice is less than 1 m (3.2 ‘) but can be as high as 3 m (10 ‘).

Winter mapping often shows smooth ice (blue), rubble ice (rough ice shown as red), and pressure ridges (yellow lines). Land is grey. Mapping icon are shown at select sites to get your oriented. Our research using satellites and drones on rough ice revealed we can map ridges or rough ice starting at 10cm (4”). In this image most of the rubble ice is less than 1 m (3.2‘) but can be as high as 3 m (10‘).

Fish. Ride. Thrive!

Below, two Ice Reports are shown using the demo data available in Ice Time from 2019. Each Ice Report contains a thumbnail image, and a description that may reference numbers. Each of these numbers is symbolized on the map so the Ice Report content is easy to find on the map. Each Ice Report has a View Map link, bottom right.

After View Map is clicked, your map opens and the features described in the report are indicated with symbols, which in this case, are numbers listed in the Ice Report. This map from 2019-12-08 showing the Lake of the Woods satellite footprint shows two stages of ice growth. Most recently, new black ice formed in the north and east which looks fractured. The boundary between the first and second stage of ice growth is shown at (2). If you want to see the Ice Report while looking at the map, just click on the “i” button icon found on the right.

Fish. Ride. Thrive!